Efficiently Extracting Sub-Domains from OpenFOAM Simulations
Simulating complex fluid flow phenomena often involves large computational domains, but the region of interest is usually much smaller. Extracting a sub-domain from OpenFOAM simulations allows for targeted analysis, reducing data processing overhead and focusing computational resources. This blog explores how to isolate and extract a sub-domain, whether to study localized flow features or to streamline data analysis workflows. We’ll cover practical steps and techniques, using OpenFOAM’s built-in tools to ensure an efficient and user-friendly process.
In computational fluid dynamics (CFD), simulations often involve extensive computational domains to capture all relevant flow dynamics. However, analyzing the entire domain is not always necessary, especially when the region of interest is localized. Extracting a sub-domain from OpenFOAM simulations is a powerful technique to focus on specific areas, such as the wake of a bluff body or the boundary layer near a surface. This process not only reduces data storage and processing requirements but also simplifies the analysis of localized flow features. In this blog, we’ll explore how to isolate and extract sub-domains in OpenFOAM, highlighting practical use cases and step-by-step guidance for implementation.
In this tutorial, I will use the simulation of three-dimensional flow around a square cylinder at a Reynolds number of 260. The flow will be simulated using Direct Numerical Simulations (DNS) implemented in OpenFOAM, following a setup closely aligned with the configuration outlined by Bai and Alam (2018) for reference. You can find a reference case setup for the flow around a square cylinder at Reynolds number 260 here.
Lets begin!!!
Extracting Sub-domain
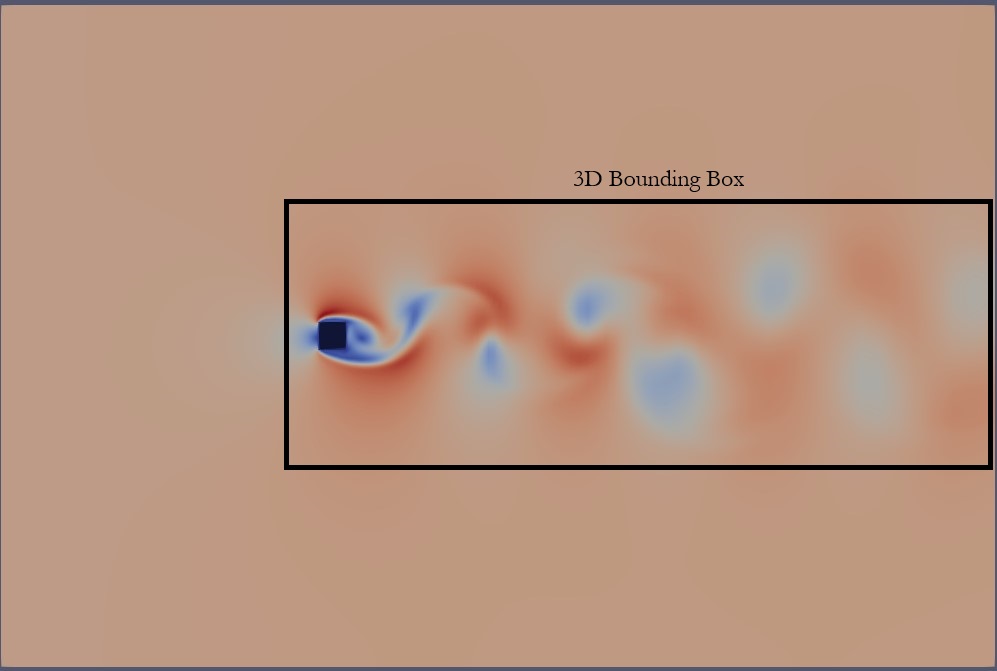
To begin, let’s define the problem. The goal is to extract a specific sub-domain from my simulation, confined within a boundary illustrated below:
In OpenFOAM, sub-domain extraction is accomplished using the topoSetDict file. The topoSet utility is a versatile tool for manipulating sets of cells, faces, and points, enabling the definition of regions for various purposes, including post-processing, sub-models, porous media, and multiple reference frame (MRF) models. The behavior of this utility is governed by the <case>/system/topoSetDict dictionary, where a sequence of operations is specified to define the desired manipulations. These operations are executed systematically to extract the sub-domain.
actions
(
    {
        name    <name-1>;
        type    <set-type>;
        action  <action>;
        source  <source-type>;

        // Additional <source-type> information
    }

    {
        name    <name-2>;
        type    <set-type>;
        action  <action-type>;
        source  <source-type>;

        // Additional <source-type> information
    }

    ...
);
The <set-type> parameter specifies the type of set to operate on, which can be:
- points:
pointSet,pointZoneSet - faces:
faceSet,faceZoneSet - cells:
cellSet,cellZoneSet
The <action-type> parameter determines how the set will be manipulated based on the <source-type> definition. Common actions include operations such as new, add, subset, delete, or subtract.
To extract a sub-domain from the three-dimensional flow around a square cylinder, we’ll leverage this utility with a tailored configuration, as demonstrated below.
actions
(
    {
        name    box1;
        type    cellSet;
        action  new;
        source  boxToCell;
        min     (-0.2 -0.5 -0.6);
        max     (2.4 0.5 0.6);
    }

	  {
        name    zone1;
        type    cellZoneSet;
        action  new;
        source  setToCellZone;
        set     box1;
    }
);
The first step involves selecting cells within a bounding box defined by the coordinates (-0.2 -0.5 -0.6) and (2.4 0.5 0.6). Next, the cellSet created from this selection is converted into a cellZone, which serves as the region of interest or sub-domain.
To implement this, simply copy the configuration snippet into a file named topoSetDict within the <case>/system/ directory. Then, execute the topoSet command in an OpenFOAM-sourced terminal. You can expect the following output:
Reading topoSetDict

Time = 1996.75
    mesh not changed.
Created cellSet box1
    Applying source boxToCell
    Adding cells with centre within boxes 1((-0.2 -0.5 -0.6) (2.4 0.5 0.6))
    cellSet box1 now size 565920
Created cellZoneSet zone1
    Applying source setToCellZone
    Adding all cells from cell set: box1 ...
    cellZoneSet zone1 now size 565920

End
After executing the command, a new directory named sets will be created within <case>/constant/polyMesh/, structured as follows:
constant/
├── polyMesh
│   ├── boundary
│   ├── cellZones.gz
│   ├── faceZones.gz
│   ├── faces.gz
│   ├── neighbour.gz
│   ├── owner.gz
│   ├── pointZones.gz
│   ├── points.gz
│   └── sets
│       ├── box1.gz
│       └── zone1.gz
├── transportProperties
└── turbulenceProperties
Visualize Sub-Domain
Once the sub-domain has been successfully extracted, the next step is to visualize it. The question arises: how can we effectively view this sub-domain?
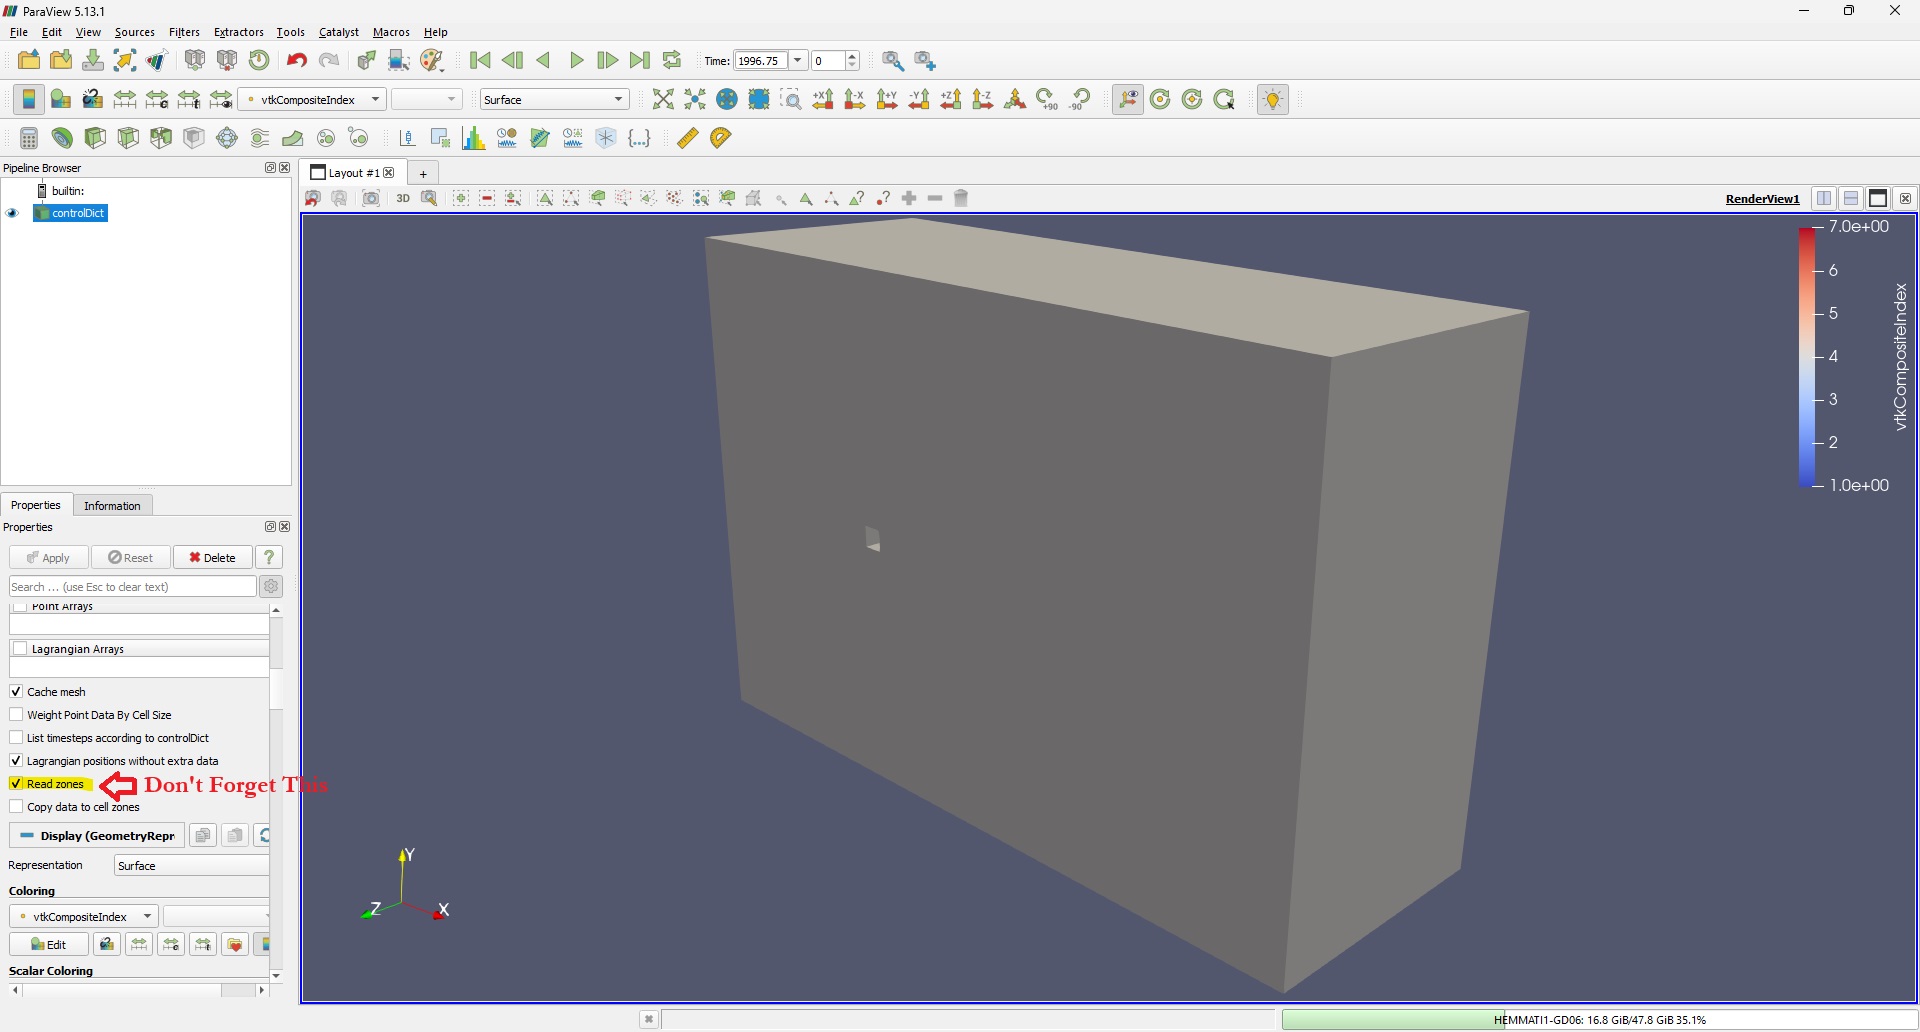
To start, we’ll use ParaView. Open your OpenFOAM case in ParaView, ensuring the Read Zones option is enabled, as shown below:
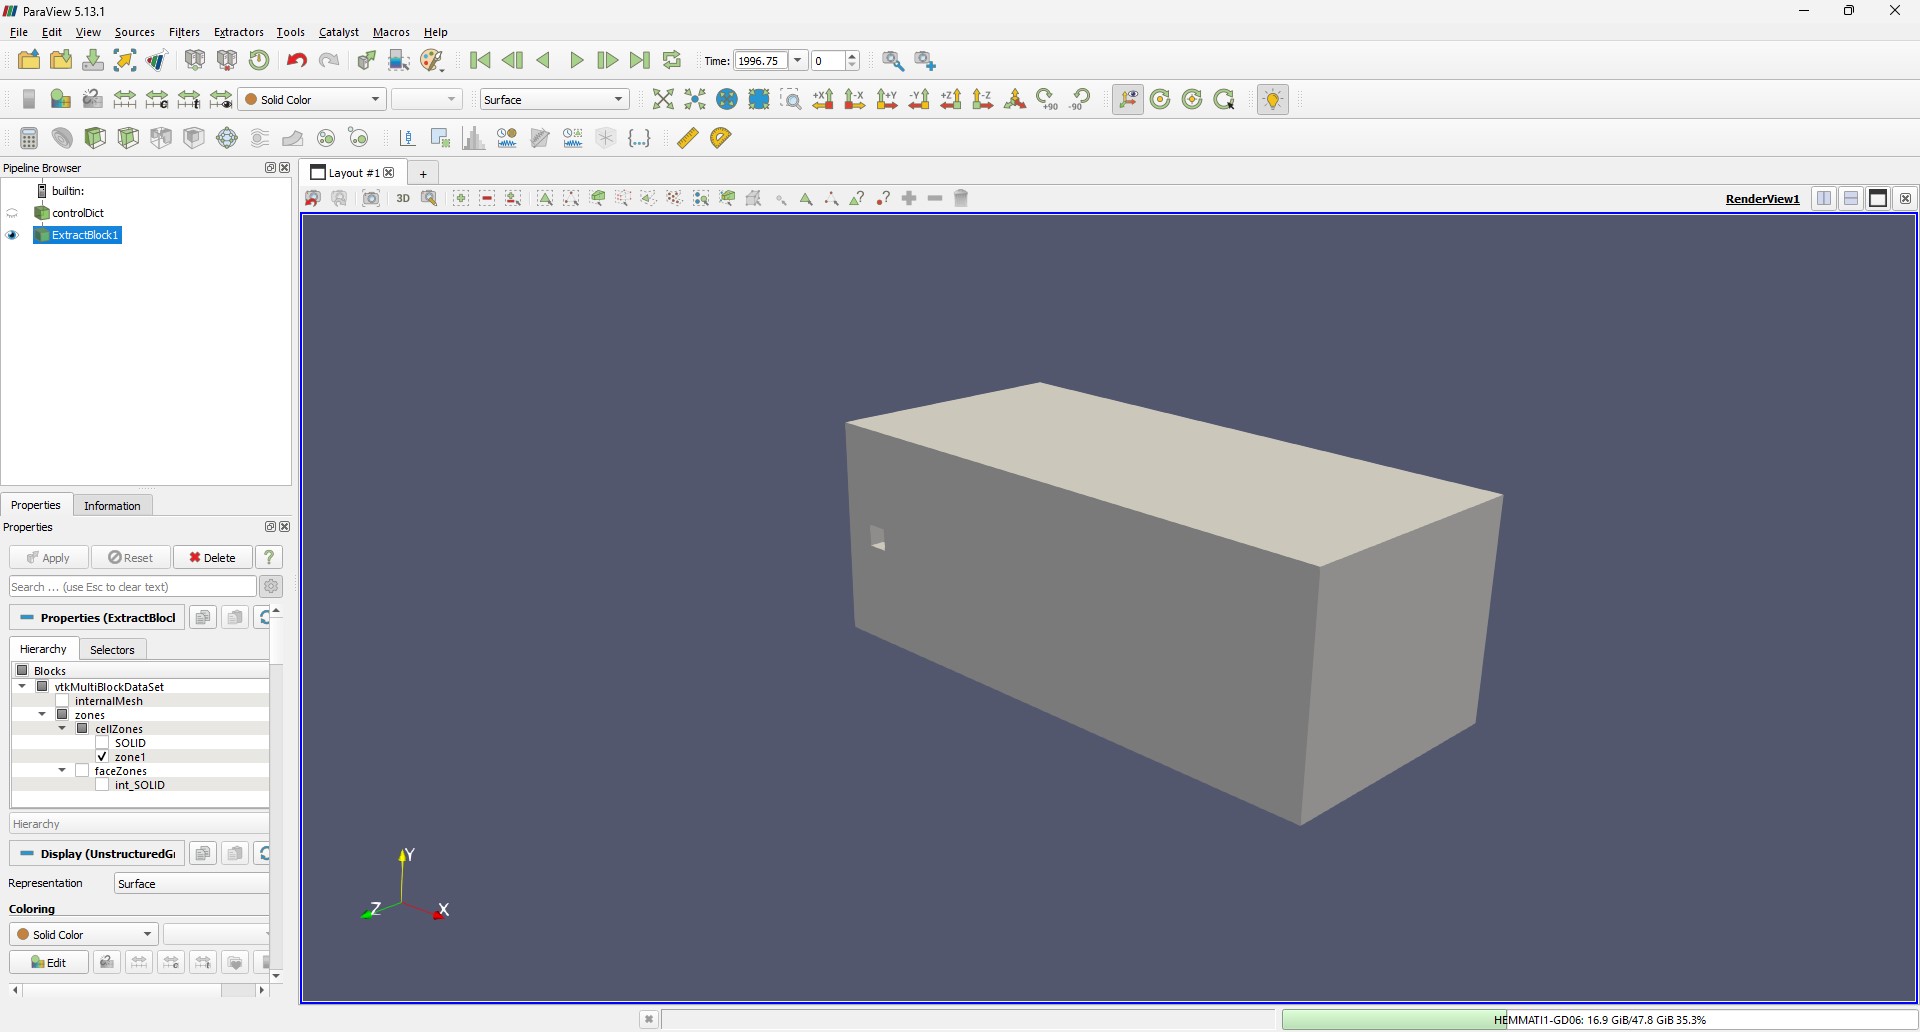
Next, locate the Extract Block filter under the Filters menu. Use this filter to select only the newly created zone - zone1 - as illustrated below:
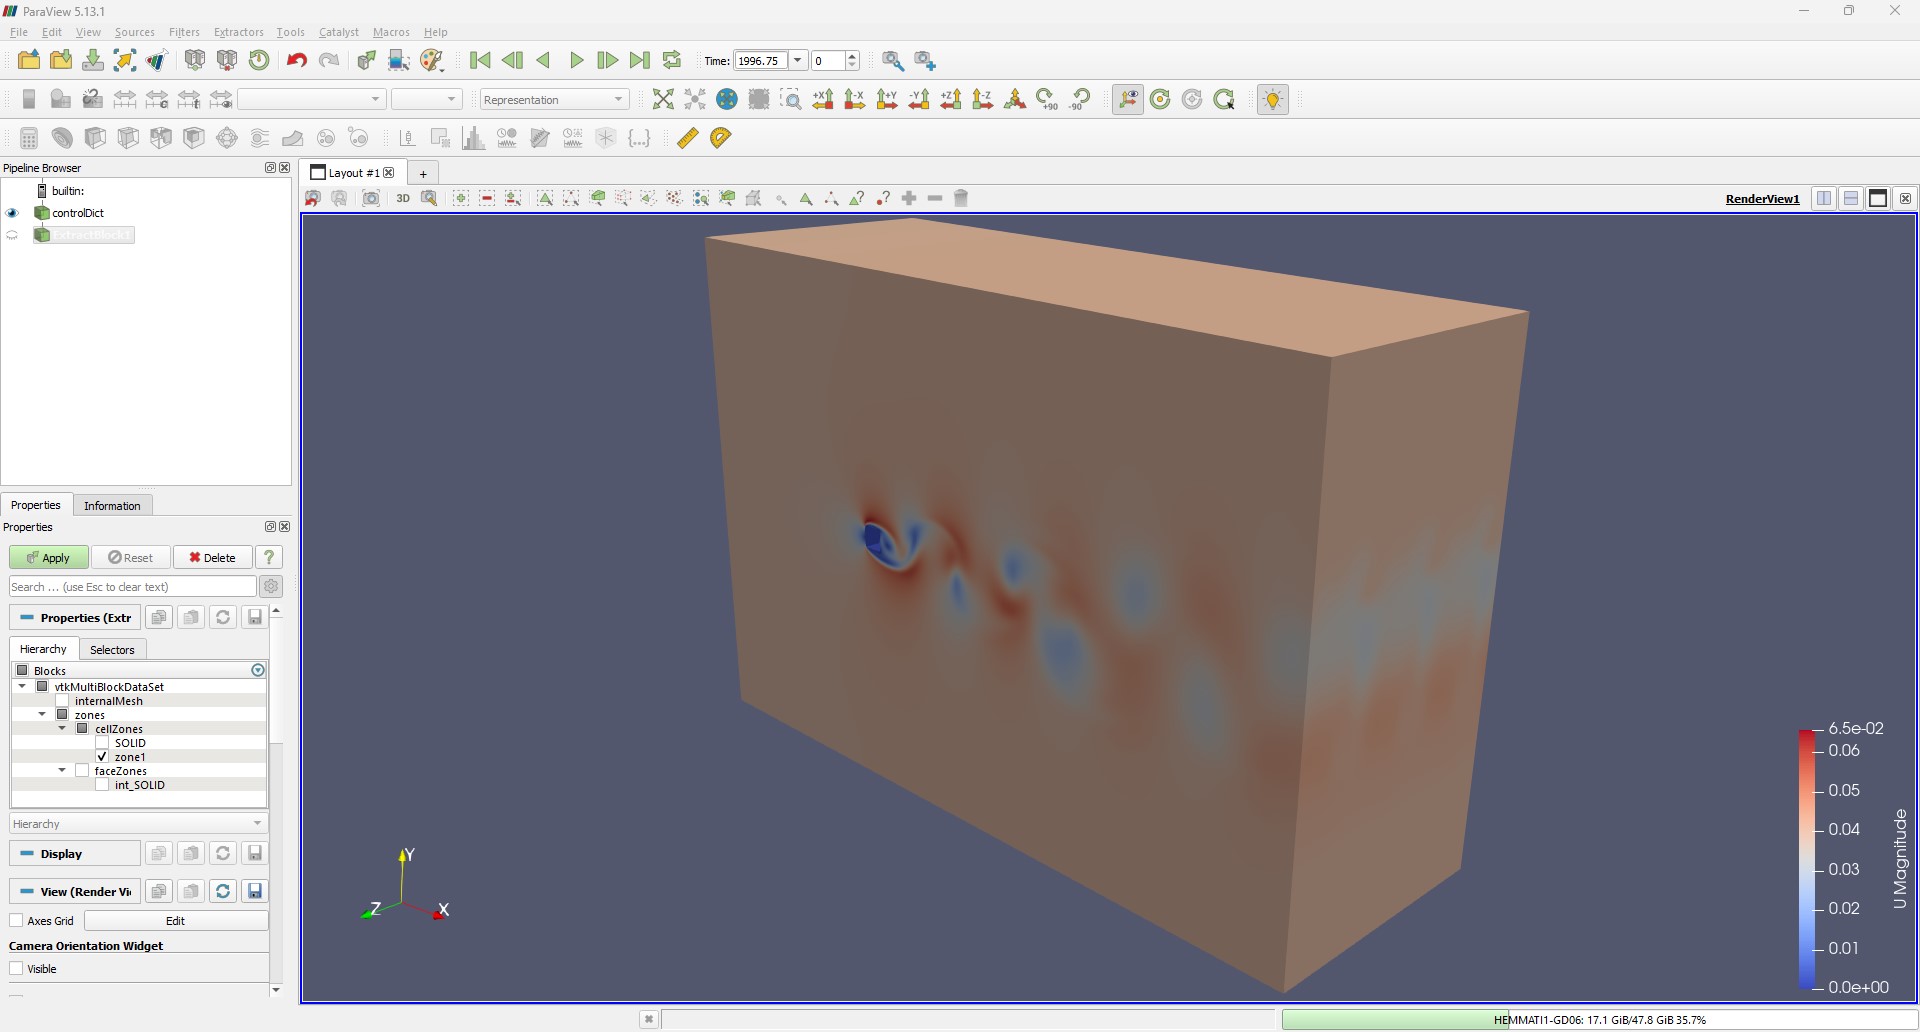
After applying the filter, you will see the extracted sub-domain displayed as follows:
At this point, you might notice that field values are not directly visible within the extracted zone. To address this and visualize the field data, we’ll leverage the volFieldValue function object. This versatile function allows the manipulation of volume field data to derive summations, averages, and extrema, or, in our case, to extract field values specifically from the newly created cellZone, as demonstrated below:
volFieldValue1
    {
        type                volFieldValue;
        libs                 ("libfieldFunctionObjects.so");
        log                  false; //true;
        writeControl timeStep;
        writeFormat     ascii; //binary;
        writeInterval 1;
        writeFields       true;//writes the fields of the volume
        //timeStart       0;
        //timeEnd         1000;
        regionType       cellZone;//cellSet; //cellZone;
        name               zone1; // box is the cellSet or cellZone defined by the topoSetDict
        operation         none;
        fields
        (
            U p
        );
    }
The simplest method to visualize the sub-domain is by using the foamToVTK utility. Execute the following command in your terminal:
foamToVTK -cellZone zone1 -latestTime
This command generates a VTK folder within your case directory. Open the corresponding VTK file from the latestTime directory in ParaView to proceed.
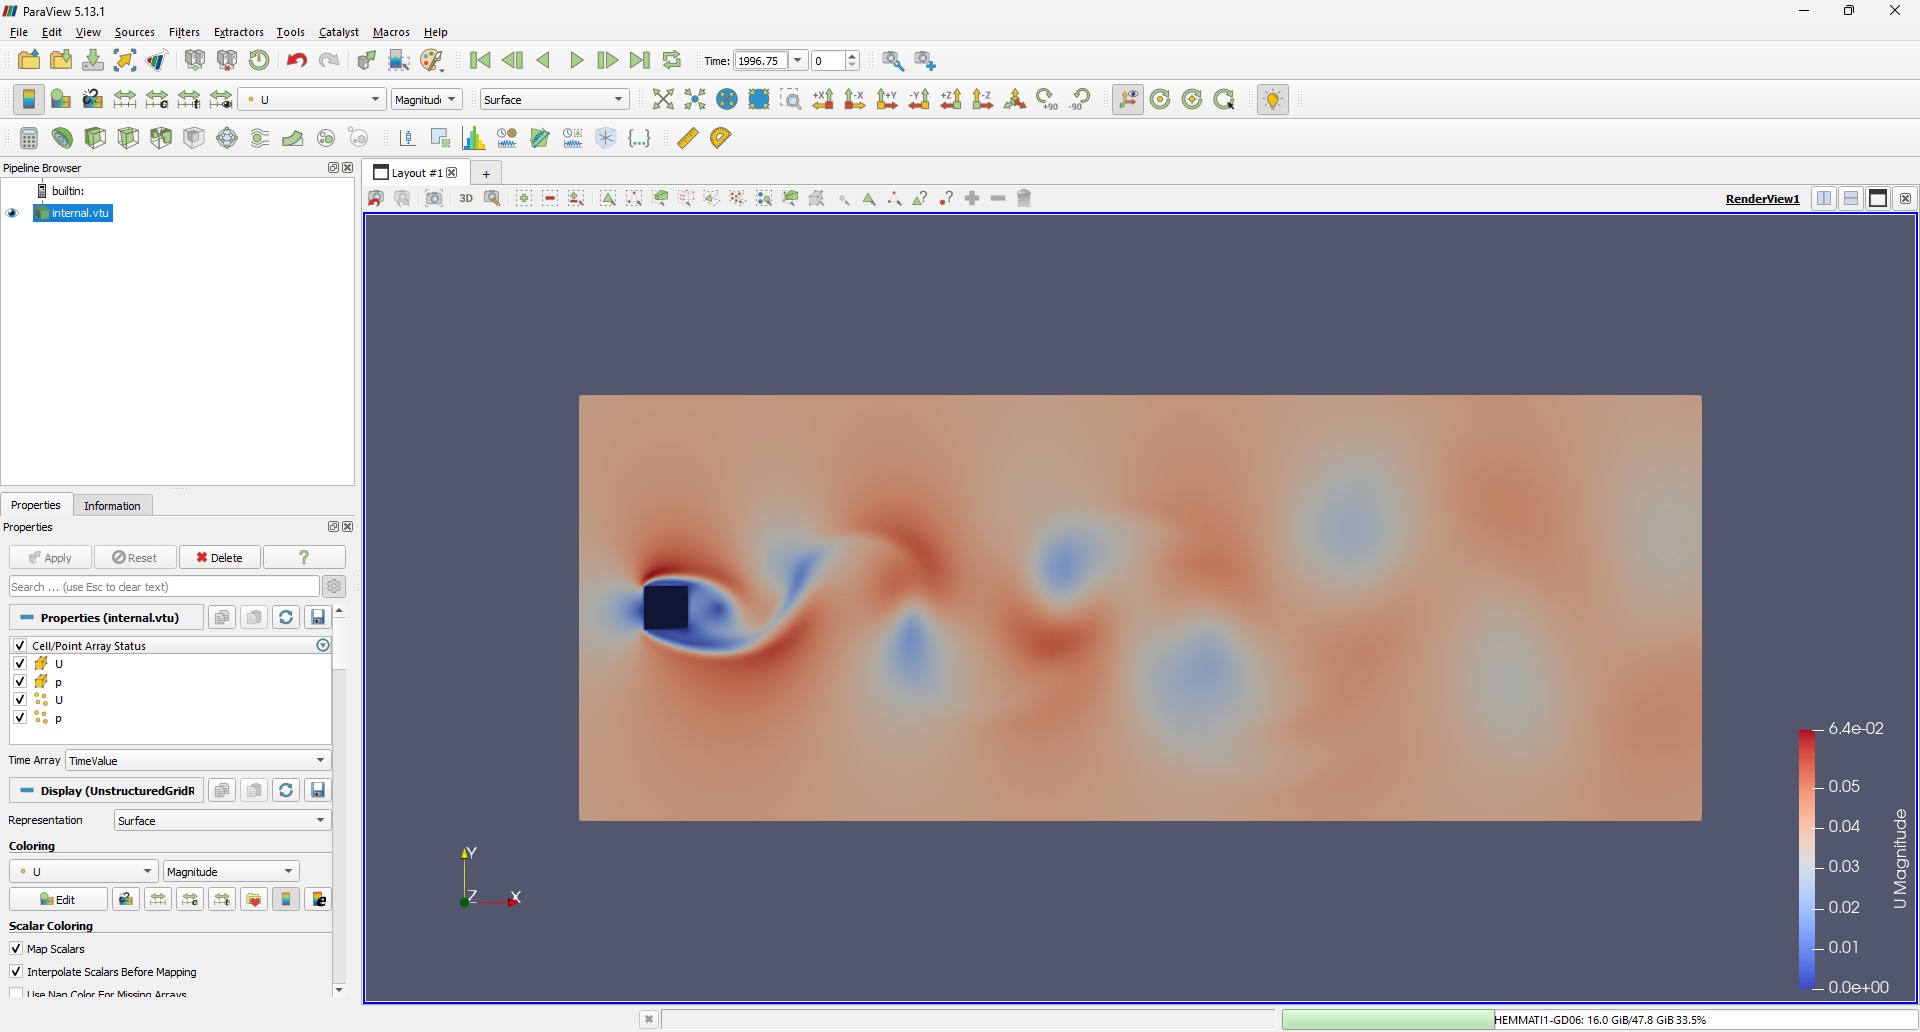
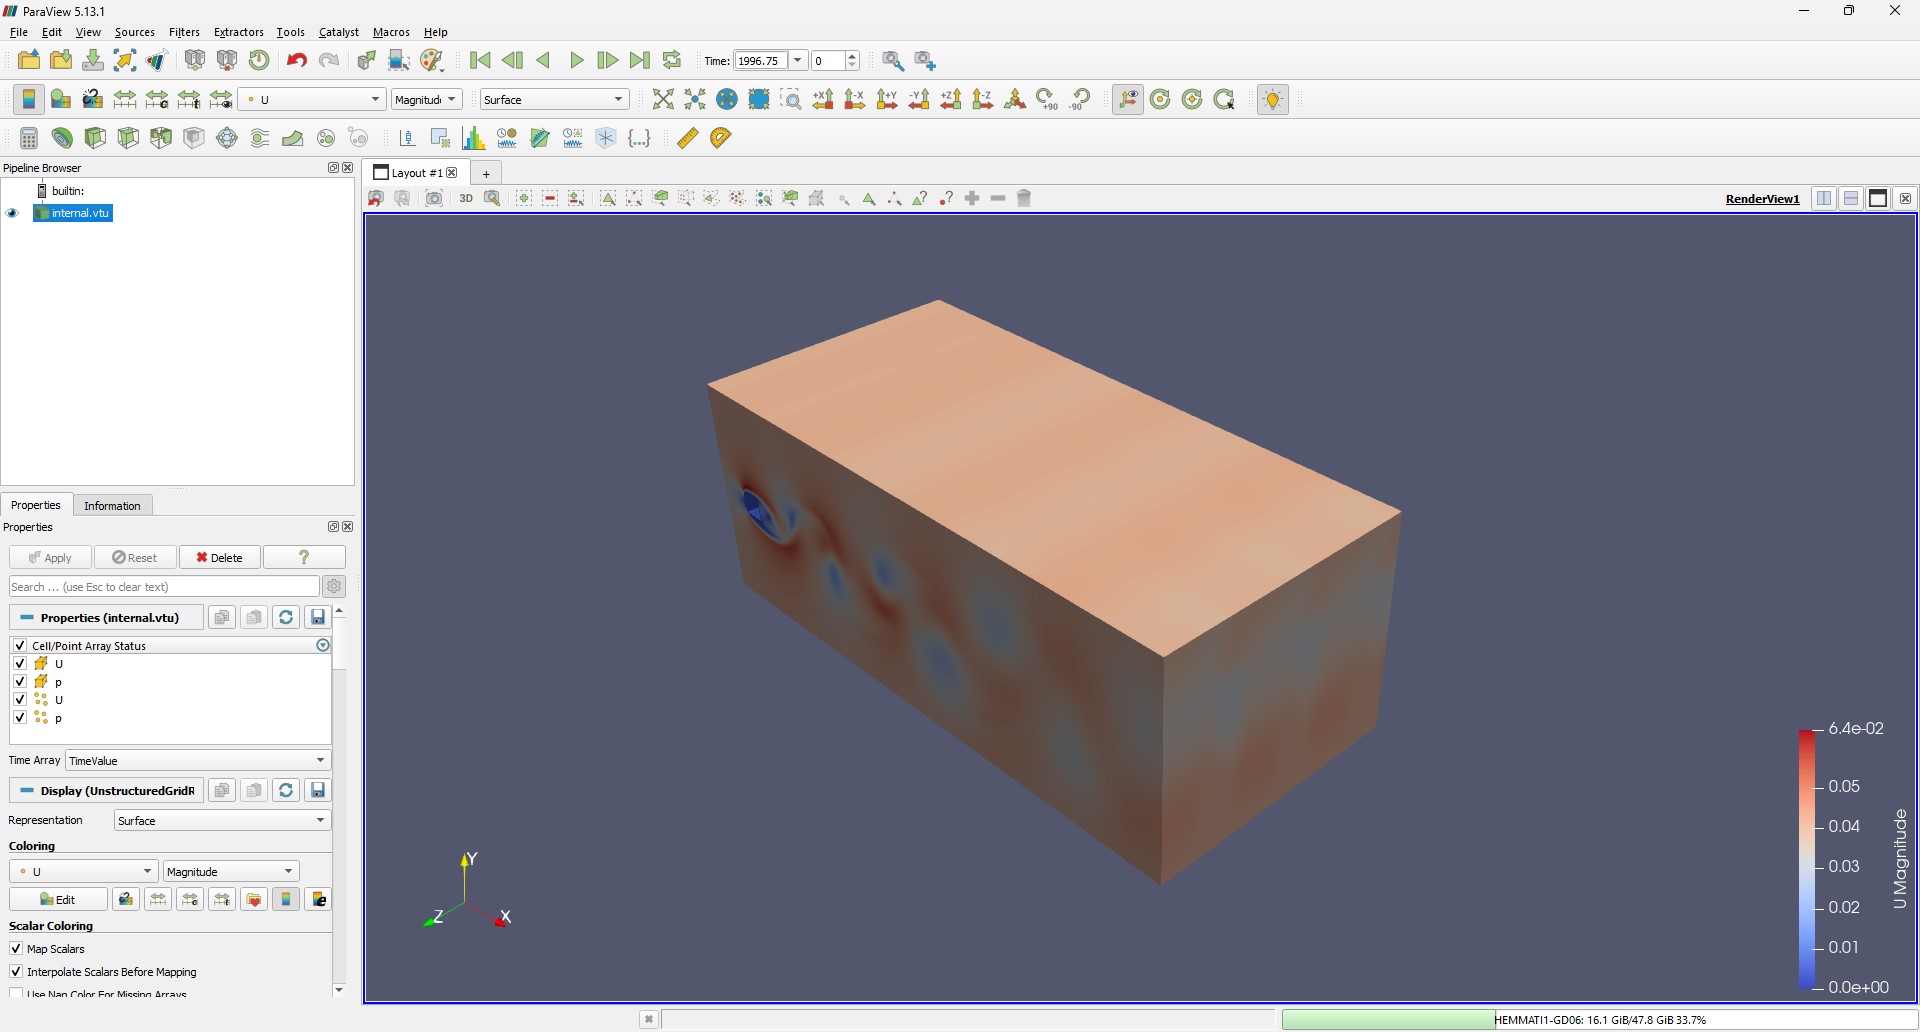
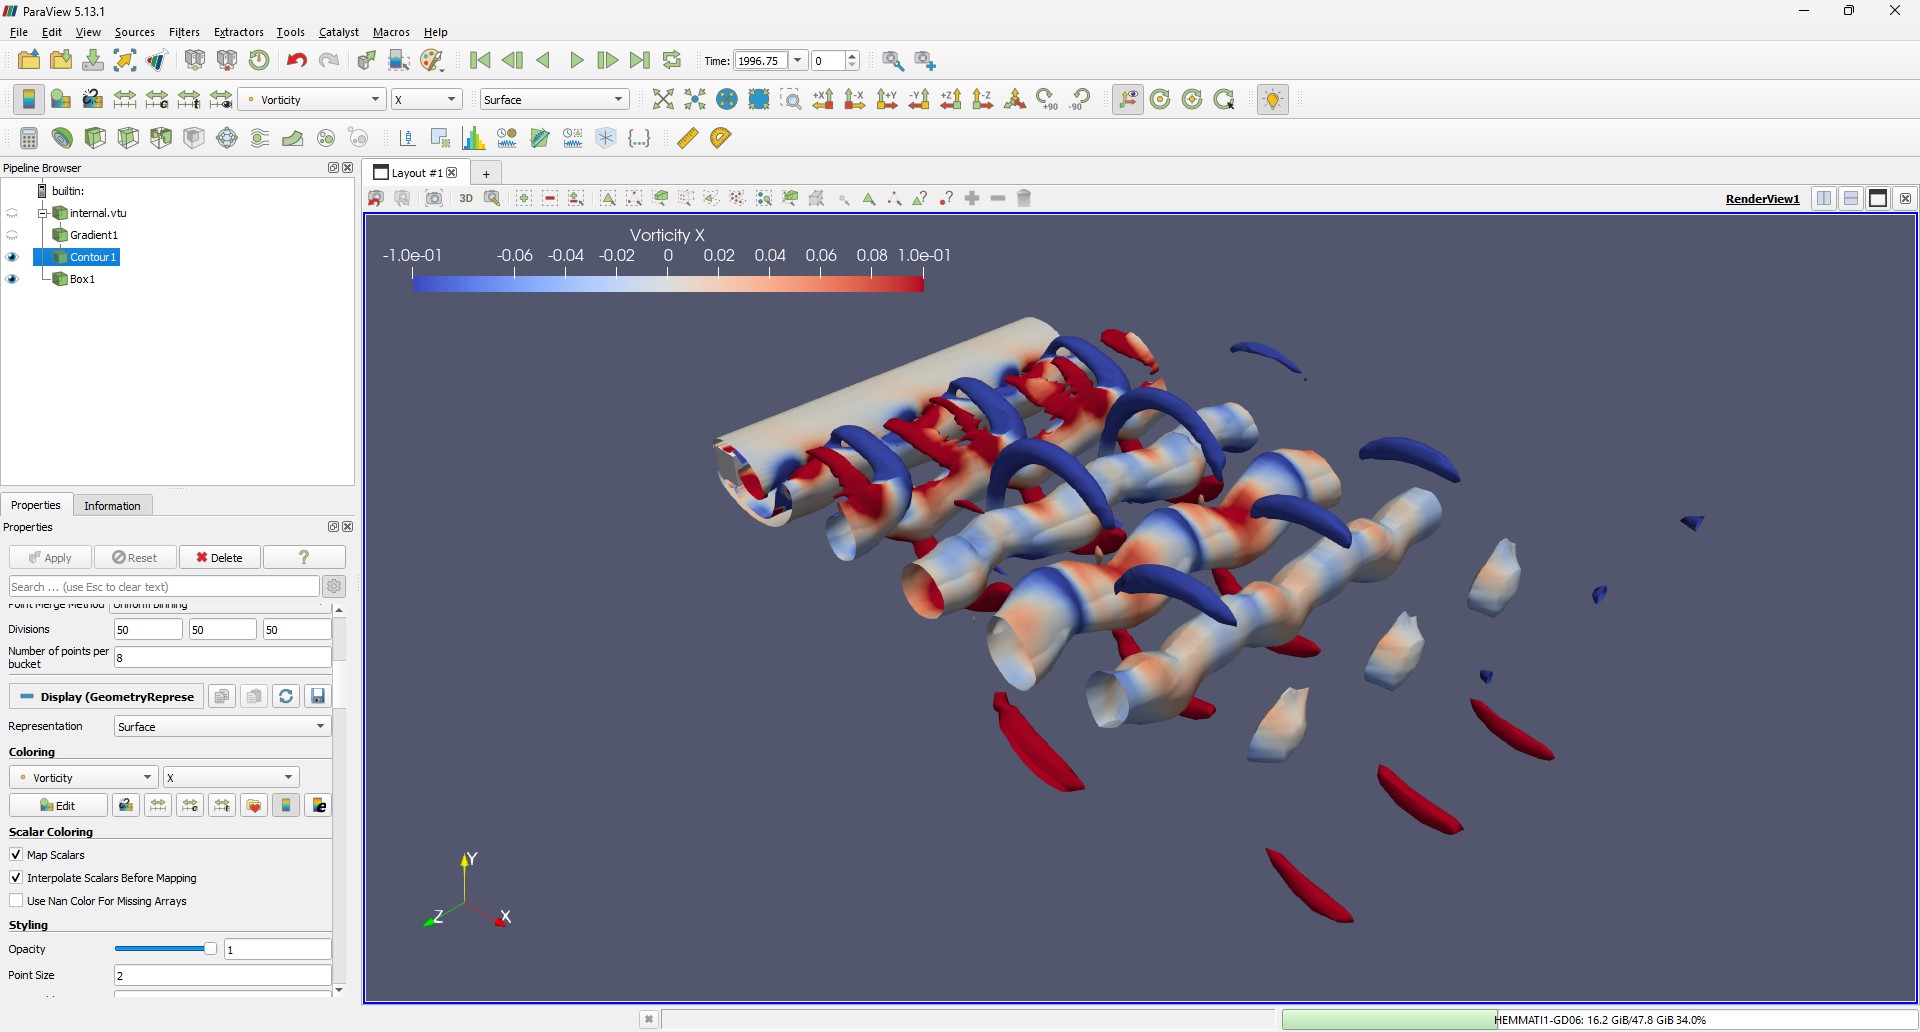
With some additional adjustments in ParaView, you can effortlessly visualize 3D flow structures, such as those revealed by the Q-Criterion, as shown below:
Finally, let’s address the important question: Why should we use this method of extracting sub-domains from OpenFOAM? Here are the key reasons.
- Focused Analysis: By isolating a specific region of interest, such as the wake behind a bluff body, researchers can perform detailed analyses on localized flow phenomena without processing the entire domain, saving computational resources.
- Data Reduction: Extracting sub-domains significantly reduces the size of the dataset, making it more manageable for storage and analysis, especially for large-scale simulations.
- Enhanced Visualization: By visualizing only the sub-domain, important flow structures, such as vortices or shear layers, become more apparent, providing clearer insights into complex flow dynamics.
- Modal Decomposition: For techniques like Proper Orthogonal Decomposition (POD) or Dynamic Mode Decomposition (DMD), extracting sub-domains helps in focusing on the regions that are most relevant to the modal analysis, improving the quality of results.
- Custom Post-Processing: The ability to work with a sub-domain enables the use of customized function objects or third-party tools like ParaView and Python scripts for specialized analyses tailored to the problem at hand.
This method bridges the gap between computational efficiency and the need for detailed insights into fluid dynamics.
In conclusion, extracting and visualizing sub-domains from OpenFOAM simulations offers a powerful approach for focused analysis, efficient data handling, and enhanced visualization. Whether for modal decomposition, flow structure analysis, or just improving computational efficiency, this method can be a valuable tool in your CFD workflow. By isolating regions of interest, you gain deeper insights into your simulation results while maintaining control over the data you process.
Enjoy Reading This Article?
Here are some more articles you might like to read next: